
Download Paper
For complete details, download my paper:
Background
Adam Young and Ben van Kerkwyk made interesting claims that certain ancient Egyptian stone vases are astonishingly precise. This motivated me to conduct an independent metrological study of similar artifacts, including:
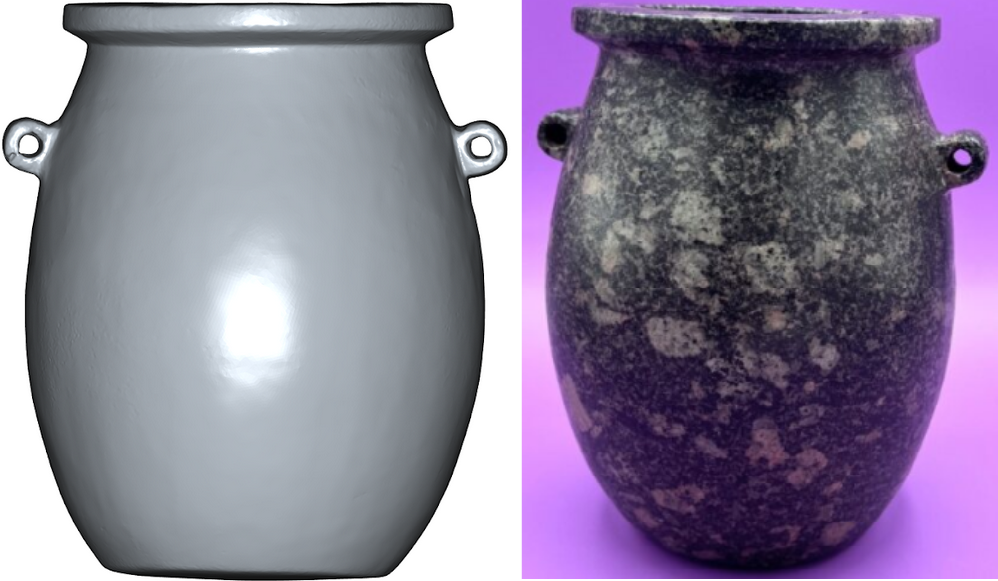
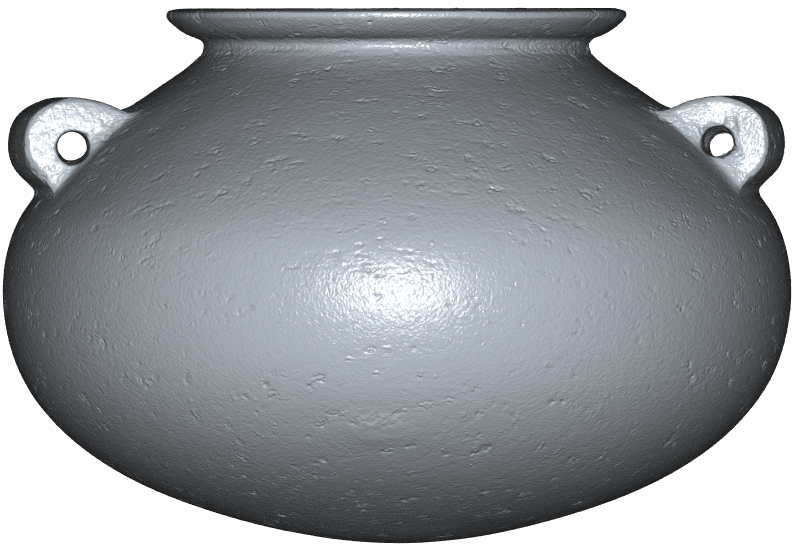
- 22 purportedly predynastic Egyptian stone vases from Matt Beall’s collection – Fig. 1;
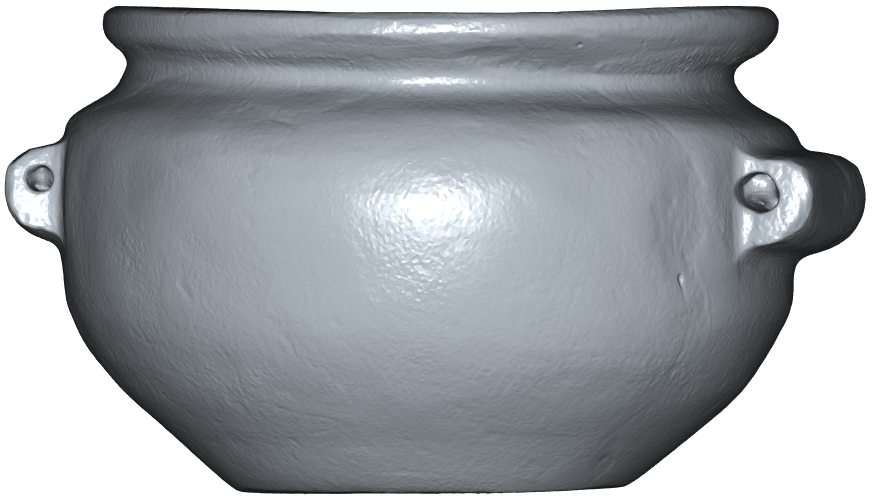
- 3 modern artisan-made ‘gift shop quality’ stone vases, which were machined and polished on a lathe – Fig. 2;
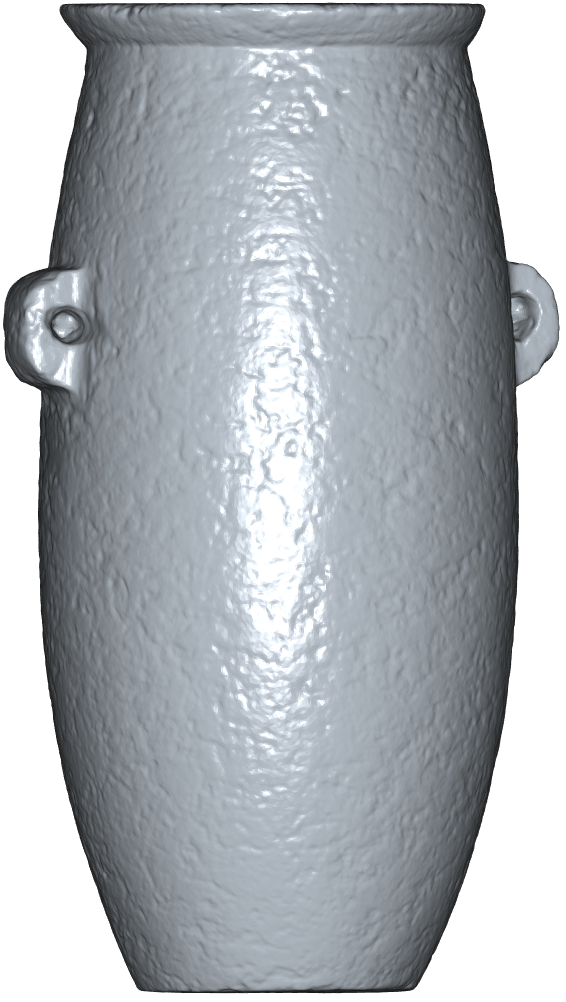
- 2 contemporary artisan-made ‘replica’ stone vases, made by Olga Vdovina using primitive wood, stone, and copper tools consistent with the technology available to the ancient Egyptians – Fig. 3.


The objective of this study was to evaluate the precision of the stone vessels using a rigorous scientific method.
The reason I use the word ‘purportedly’ to describe Matt Beall’s collection is because most academic archeologists do not consider objects in private collections genuine and therefore generally exclude them from scientific study citing the lack of provenance and archeological context. Indeed, when there are no proper records, how can we tell if these objects were indeed found in Egypt? Or how can we attribute them to the predynastic period without knowing how and where they were found?
Fortunately, most objects in Matt Beall’s collection have well-documented provenance records, which I summarize in Appendix A.
In the meantime, Karoly Poka and Brothers of the Serpent have already scanned multiple objects from the Petrie Museum of Egyptian Archeology in London, UK. If / when they make these scans available I will be able to analyze them using the same methodology, and it will be interesting to see if the results will be similar.
Importance of Statistics
Because all scientific analysis is comparative, examining a large dataset is the best way to arrive at a meaningful conclusion. In science one rarely relies on a thesis that hinges on a single data point because such a thesis is difficult to defend. Randomness and chance play tricks on us, forcing us to rely on statistics when we wish to know anything with certainty. As such, a thesis supported by statistics is much more sound since it tends to exclude biases and errors arising from insufficient sampling.
Dataset
The source dataset consisted of 2 optical scans (for the objects O1 and O2) and 25 CAT scans processed into 3D models that were saved as STL files. The scanning was performed at EMS, Inc. using a Nikon 4M-RTSS scanner.
An EMS technician manually aligned each scanned model to ensure maximum axial symmetry. Each model was centered on the origin in the XY plane with the principal axis of symmetry being the Z axis – Fig. 4.

Model Slices
To analyze the models I wrote code in MatLab (using the MatGeom 1.2.8 library) to slice each STL model into 101 slices evenly spaced along the Z-axis – Fig. 5.
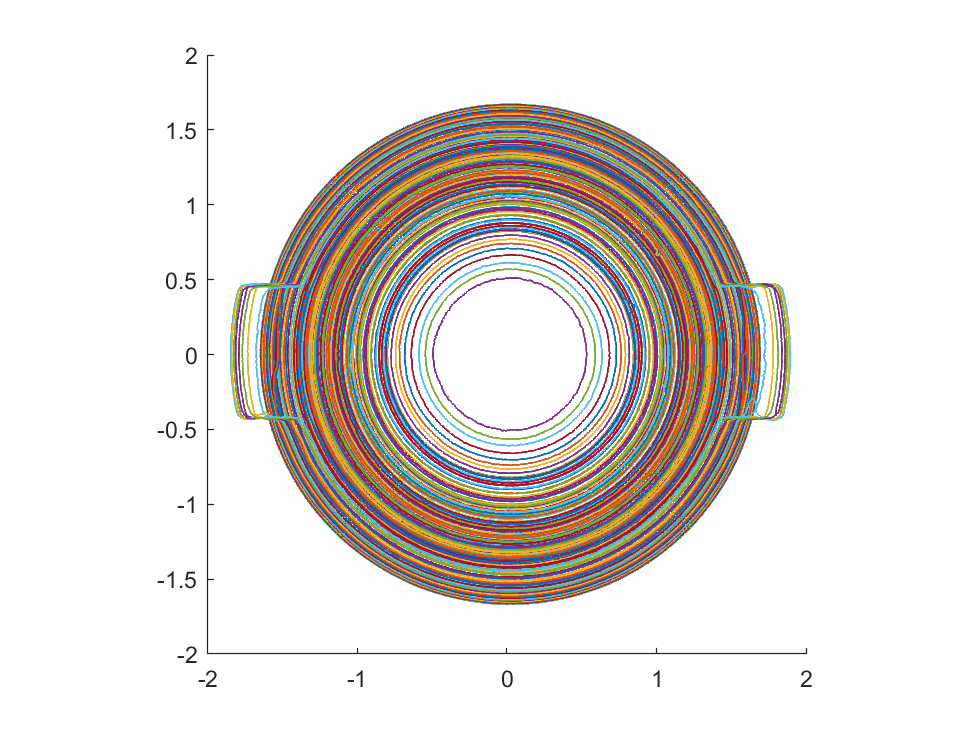
Because most objects exhibited wear along the top and bottom surfaces, the first slice and the last slices were offset 0.040” from the bottom and the top of each object.
Note that the vast majority of the model slices (except those that cut through the handles) are circular. This is expected since the vases are axially symmetric and we are slicing the model across the axis of symmetry (which is the z-axis).
Quality Metric
First, we must clarify what we mean by ‘precision’. Precision is not an absolute but rather a relative measure characterizing how close an object is to its ideal. For example, when machining a part we use tolerances to specify the maximum allowed deviation of the actual shape of the machined part from its ideal given by a dimensional drawing or a CAD model.
However, in the case of ancient Egyptian vases, we do not have such a priori design documents, which we can use for comparison. Therefore we must abandon the idea of tolerances and define another quality metric.
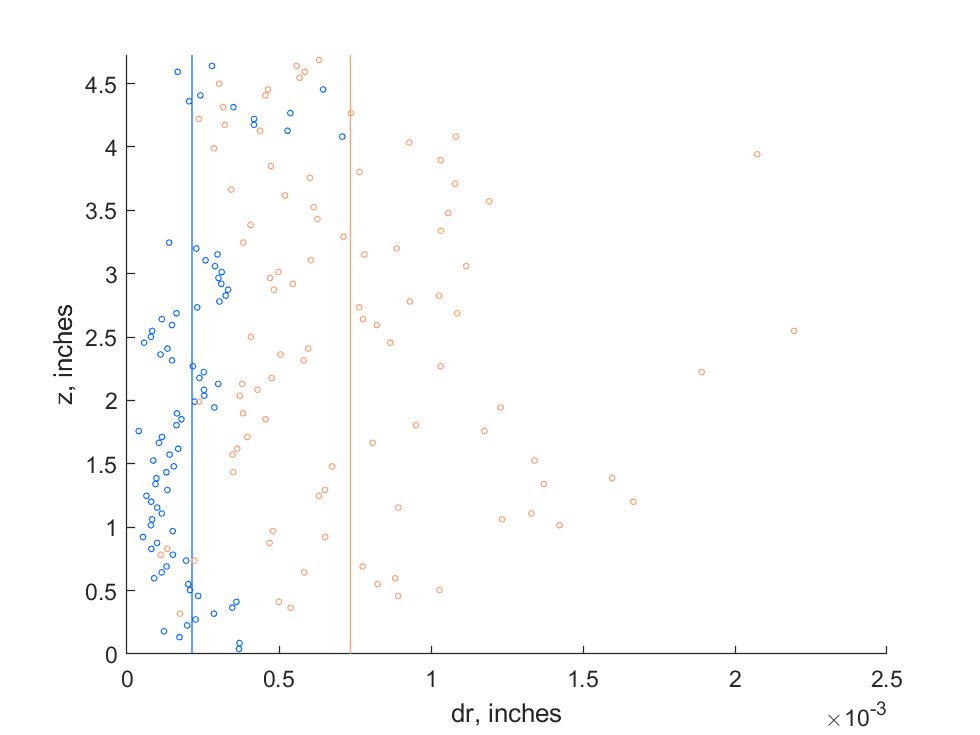
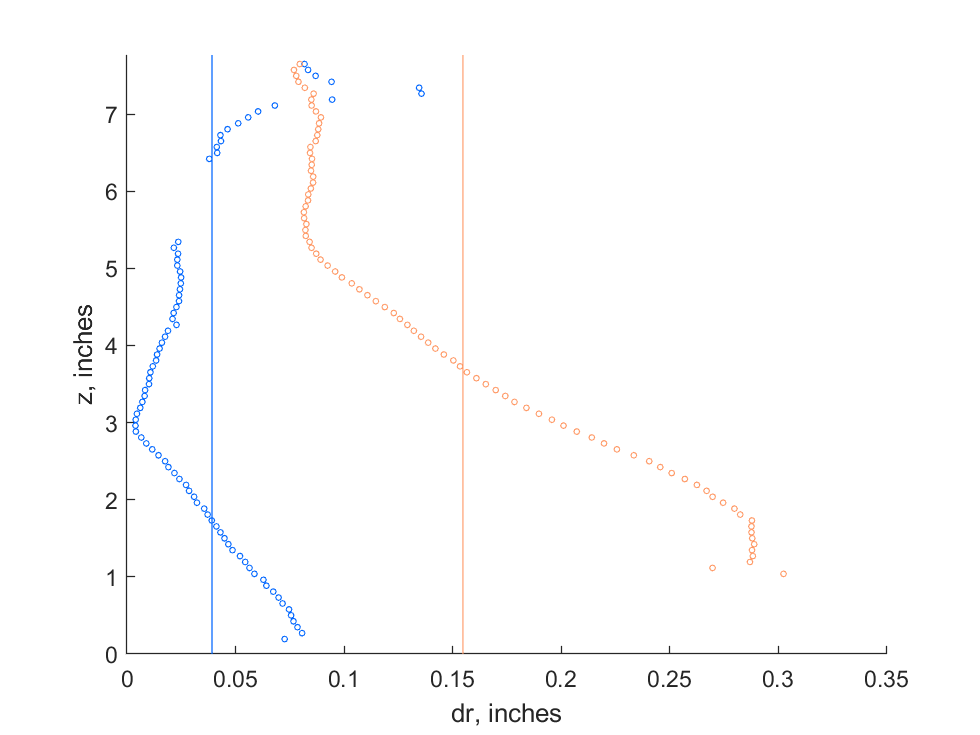
Since the model slices are approximately circular, I decided to evaluate the quality of each slice’s fit to a perfect circle in the least squares sense. The result of the fit is the best-fit radius R, the root mean square error (RMSE), and the best-fit center (x, y), from which I compute the centering error dR =√ (x2+y2) – Fig. 6.
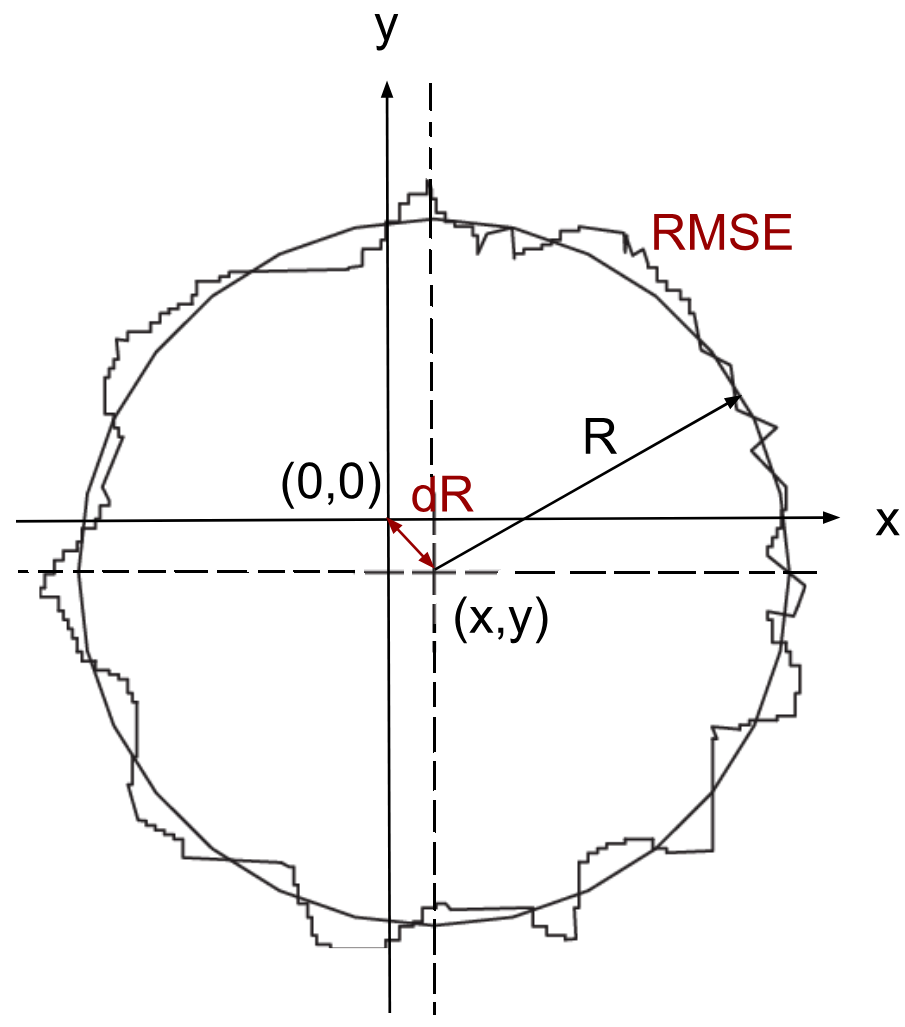
Small values of RMSE and dR mean that the slice is ‘very circular’ and ‘well centered’ on the origin, while large values of RMSE and dR mean that the slice has ‘poor circularity’ and is ‘poorly centered’ on the origin.
Combining the results for all slices, we can compute the average RMSE (<RMSE>) and the average dR (<dR>) for the inner and outer surfaces of a model. Then we can define the quality metric M as follows: M = <RMSEouter> + <RMSEinner> + <dRouter> + <dRinner>.
Slice Filtering
Because slices cutting through the handles are non-circular we ought to exclude them from the analysis. Other slices to be excluded are the slices through badly worn top and bottom surfaces and the slices that are too oblique. For example, slices through the lower portions of the rounded-bottom vases and top and bottom surfaces of the lip of a vase are ‘noisy’ because the oblique slicing angle disproportionally magnifies surface imperfections (this effect is similar to the elongation of shadows that occurs when objects are illuminated from low angles).
Through trial and error I implemented the following slice filtering algorithm: all slices with RMSE greater than twice the <RMSE> are eliminated; this procedure is repeated 3 times to eliminate the noisiest outliers.
An alternative approach is to include only the slices from the bottom portion of a vase up until the handle. Such a procedure requires an operator input to specify the value of z where a handle begins. This is not ideal since manual intervention introduces an operator-dependent degree of subjectivity into the analysis. For the rounded-bottom vessels, this approach requires even more operator input to specify the value of z, below which the slices must be excluded due to the excessively oblique slicing angle.
As such, I settled on the first approach because it allows for complete automation and does not require human participation, which could lead to undesirable selection effects.
Calibration
To ensure the validity of measurements, EMS, Inc. has calibrated the CT scanner by scanning a ruby T-stylus sphericity set (a NIST traceable metrological standard), which contained a small bead with the radius R = 1.99820 mm – Fig. 7.
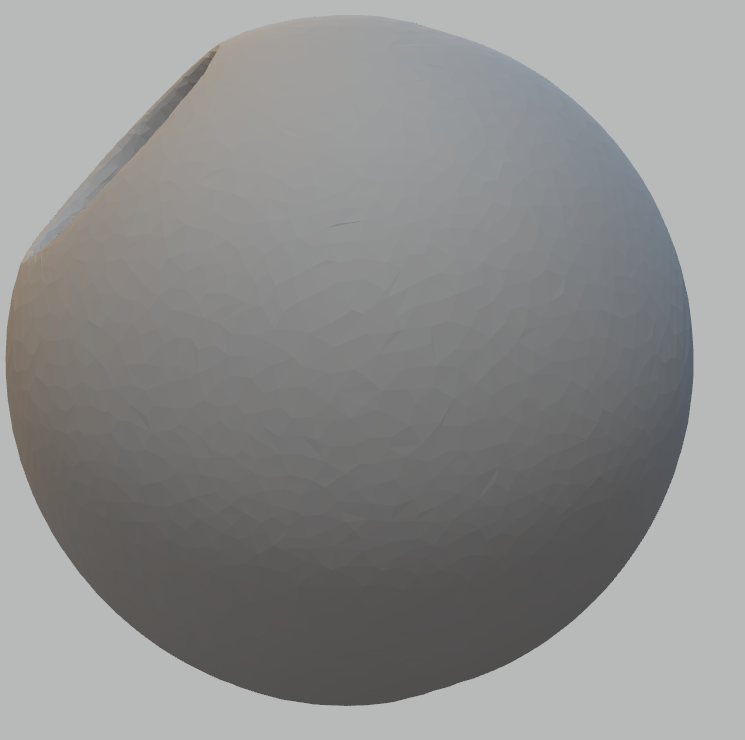
I analyzed the resulting STL file using the same MatLab code I used to analyze the stone vases and obtained the following results: <RMSE> = 0.0001”, <dR> = 0.0003”. The measured radius of the standard was Rmax = 2.0026 mm, which corresponds to the error of 0.0044 mm or 0.00017”.
Thus, I was able to establish that my analysis of the CT scans is accurate to within 0.2 thousandths of an inch.
Sample Results
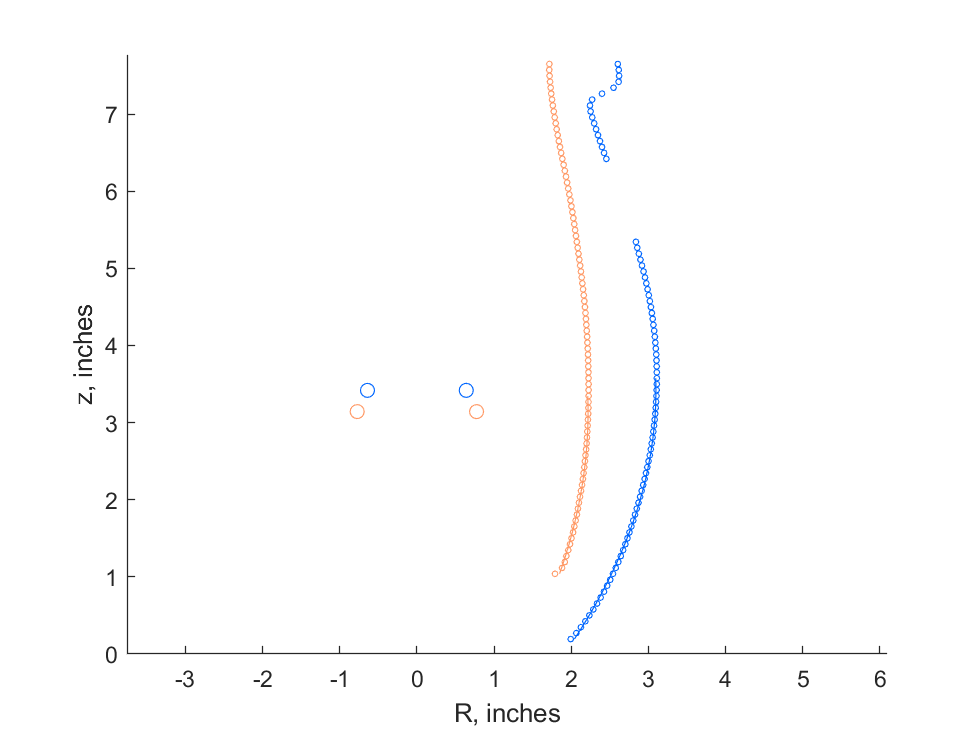
Below are the examples of the analysis of the two stone vases from Matt Beall’s collection characterized by the vastly different quality metrics: the vase ‘V18’ on the left is a lot more ‘circular’ and ‘well centered’ than the vase ‘V8’ on the right – Fig. 8-17.
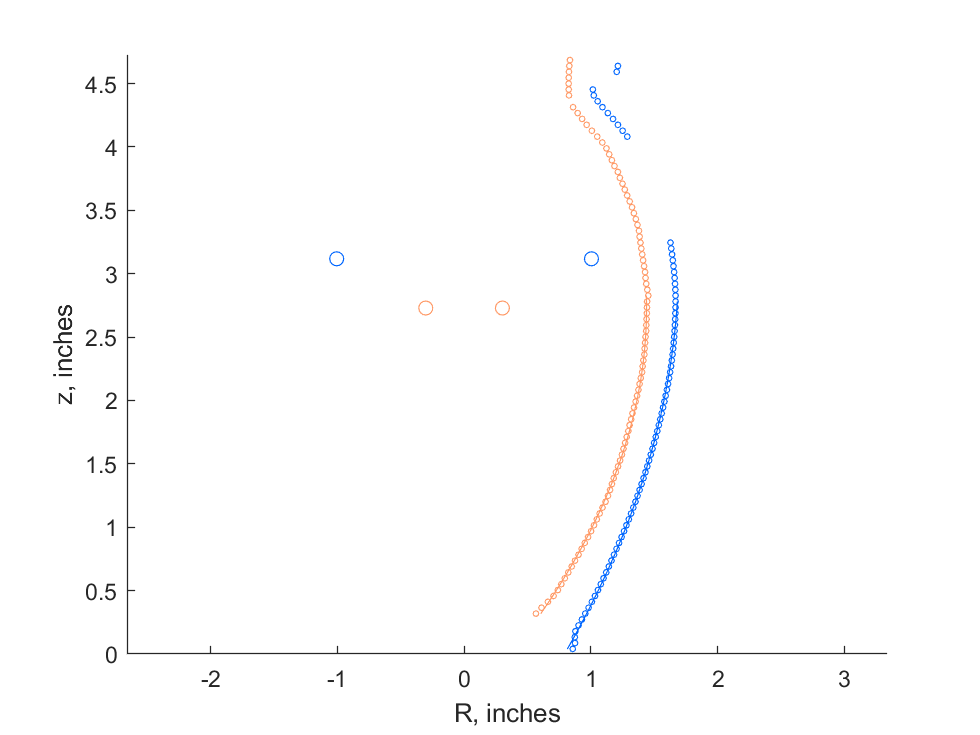
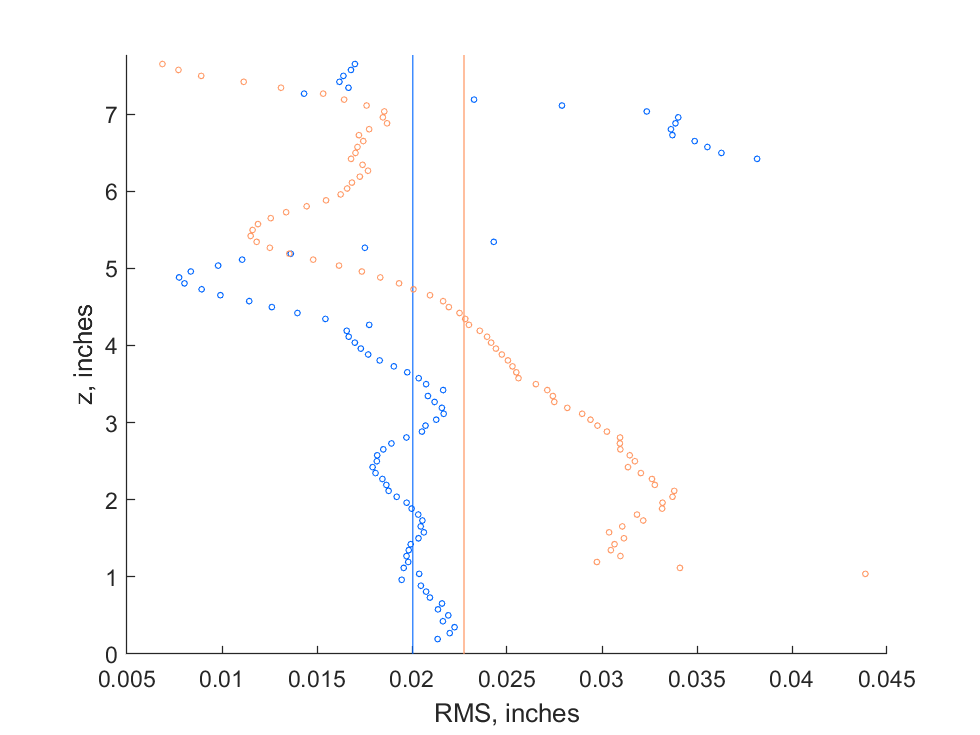
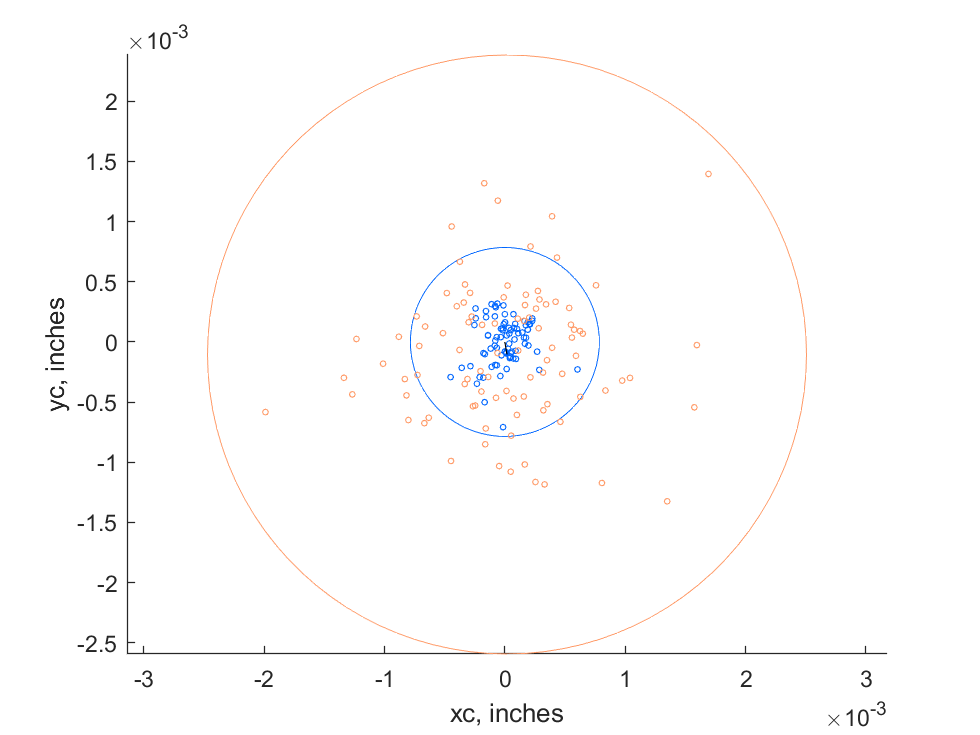
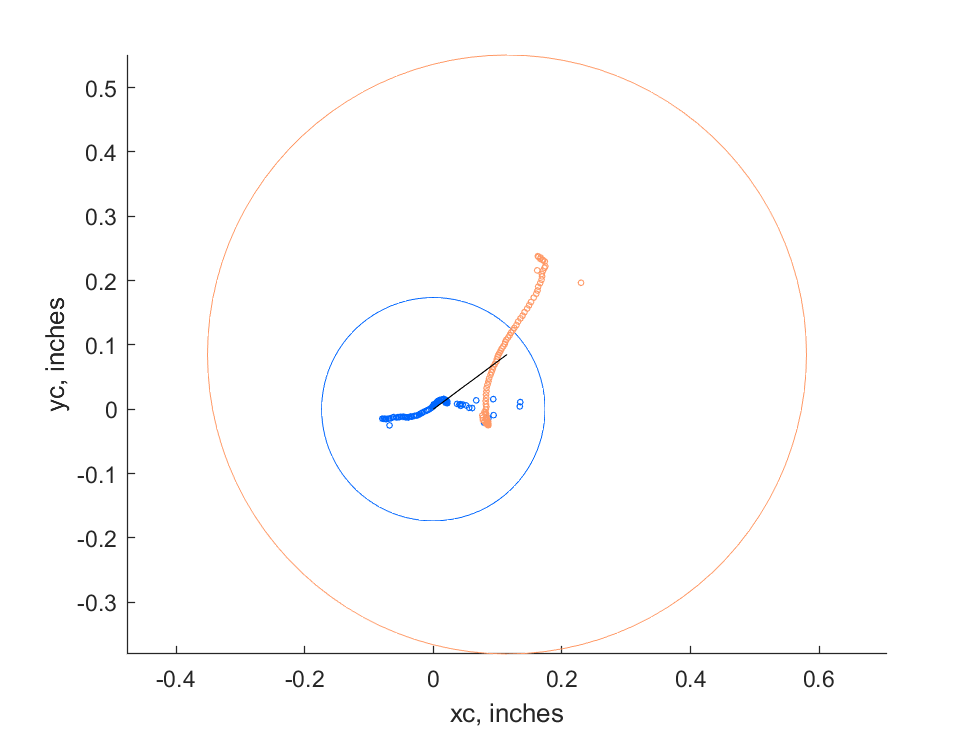
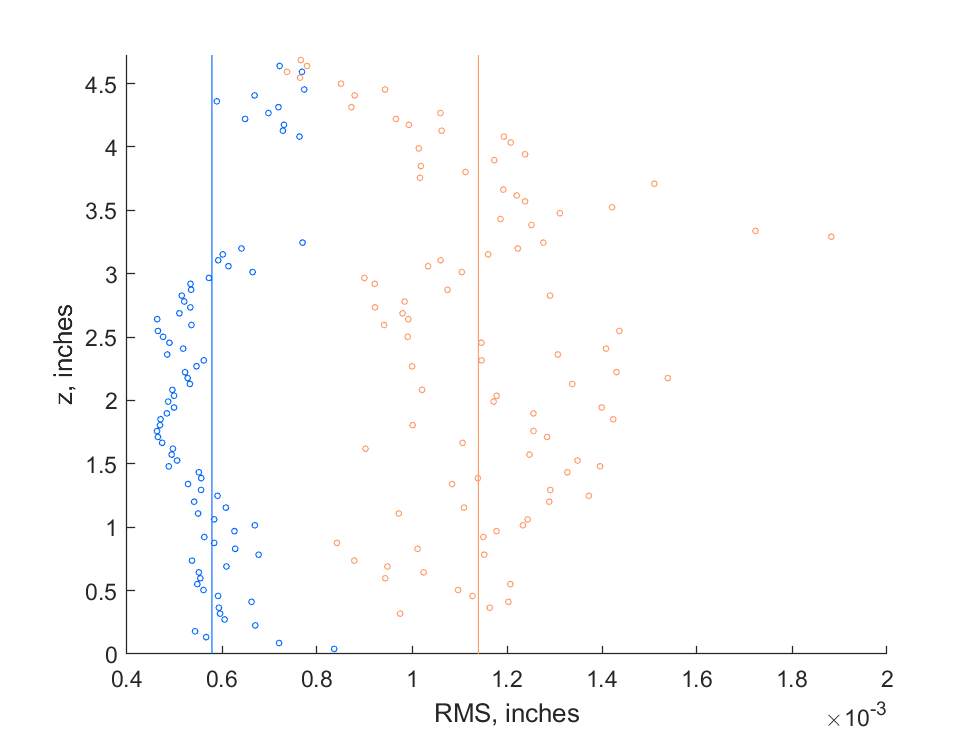
| ID | <RMSEouter> | <RMSEinner> | <dRouter> | <dRinner> | σouter | σinner | Center Error | Total Error |
| V18 | 0.5 | 0.9 | 0.2 | 0.7 | 0.1 | 0.4 | 0.1 | 2.9 |
| V8 | 20.5 | 22.8 | 21.6 | 151.2 | 13.6 | 99.4 | 133.3 | 462.4 |
For convenience, the results of the analysis of the two vases are summarized in Table 1. The vase ‘V18’ is 40 to 100 times more precise than the vase ‘V8’ in terms of <RMSE> and <dR>.
The ‘Total Error’ in the last column of the table, which is a sum of all metrics listed in the table, paints an even starker picture since it amplifies the gap between the ‘precise’ and the ‘imprecise’ artifacts.
Two Classes of Objects
A scatter plot of <RMSE> vs <dR> for all objects in this study is shown in Fig. 18 and a bar plot of the quality metric M is shown in Fig. 19.


The scatter plot in Fig. 18 illustrates how the objects in this study tend to cluster into two classes. The bar chart in Fig. 19 allows precisely define the two classes as follows:
- THE PRECISE CLASS: M < 25 thousandths of an inch;
- THE IMPRECISE CLASS: M > 25 thousandths of an inch.
Conclusion
The proposed quality metric M = <RMSEouter> + <RMSEinner> + <dRouter> + <dRinner> revealed that the objects in this study fall into two distinct categories ‘PRECISE’ and ‘IMPRECISE’.
The ‘PRECISE’ class includes modern stone vases, which were machined and polished on a lathe as well as 11 objects from Matt Beall’s collection.
The ‘IMPRECISE’ class includes 11 objects from Matt Beall’s collection and the two contemporary replica vases made using wood, stone, and copper tools consistent with the technology available to the ancient Egyptians according to academic science.
In other words, the ‘PRECISE’ class appears to be consistent with machining, whereas the ‘IMPRECISE’ class appears to be consistent with manual labor.
Discussion
It is nothing short of astonishing to find that the most ‘precise’ vases in Matt Beall’s collection (e.g. V18 and V4) are characterized by the circularity error <RMSE> = 0.6 thousands of an inch (15 microns) and the centering error <dR> = 0.1 thousandths of an inch (2.5 microns). The centering error of the vase V18 is actually below the resolving ability of the analysis methodology used (0.2 thousandths of an inch).
The vases V4 and V18 appear to be 10 times more precise (in terms of the quality metric M) compared to the modern vases. However, the modern ‘gift shop’ vases M1, M2, and M3 were of average rather than exceptional quality as they were purchased on eBay for about $15 each. Such onyx vases are typically made on simple lathes in artisan shops in Asia. BTW, Onyx’s hardness on the Moh’s scale is 6.5-7, which is comparable to the hardness of granite.
Thus, it appears to me conceivable that with greater care and/or on a better quality lathe one can probably match the remarkable precision of V4 or V18.
At the same time, it appears utterly inconceivable that such remarkable precision can be achieved using primitive ‘stone and stick’ technology, as the manually made ‘replica’ vases O1 and O2 clearly show.
Class Averages
The ‘PRECISE’ class average errors are as follows:
- <<RMSE>> = 1.3 thousandths of an inch (0.03 mm);
- <<dR>> = 1.3 thousandths of an inch (0.03 mm).
Such surprising precision indicates a highly advanced manufacturing technique consistent with machining on a lathe.
On the other hand, the ‘IMPRECISE’ vases in Matt Beall’s collection are characterized by the following class averages:
- <RMSE> = 12 thousandths of an inch (0.3 mm);
- <<dR>> = 23 thousandths of an inch (0.5 mm).
This manufacturing quality is indicative of a much less advanced manufacturing technique consistent with the ‘stone and stick’ technology.
In other words, there is a huge gap in quality between the two classes of artifacts, which spans more than an order of magnitude in precision.
Lathe Marks
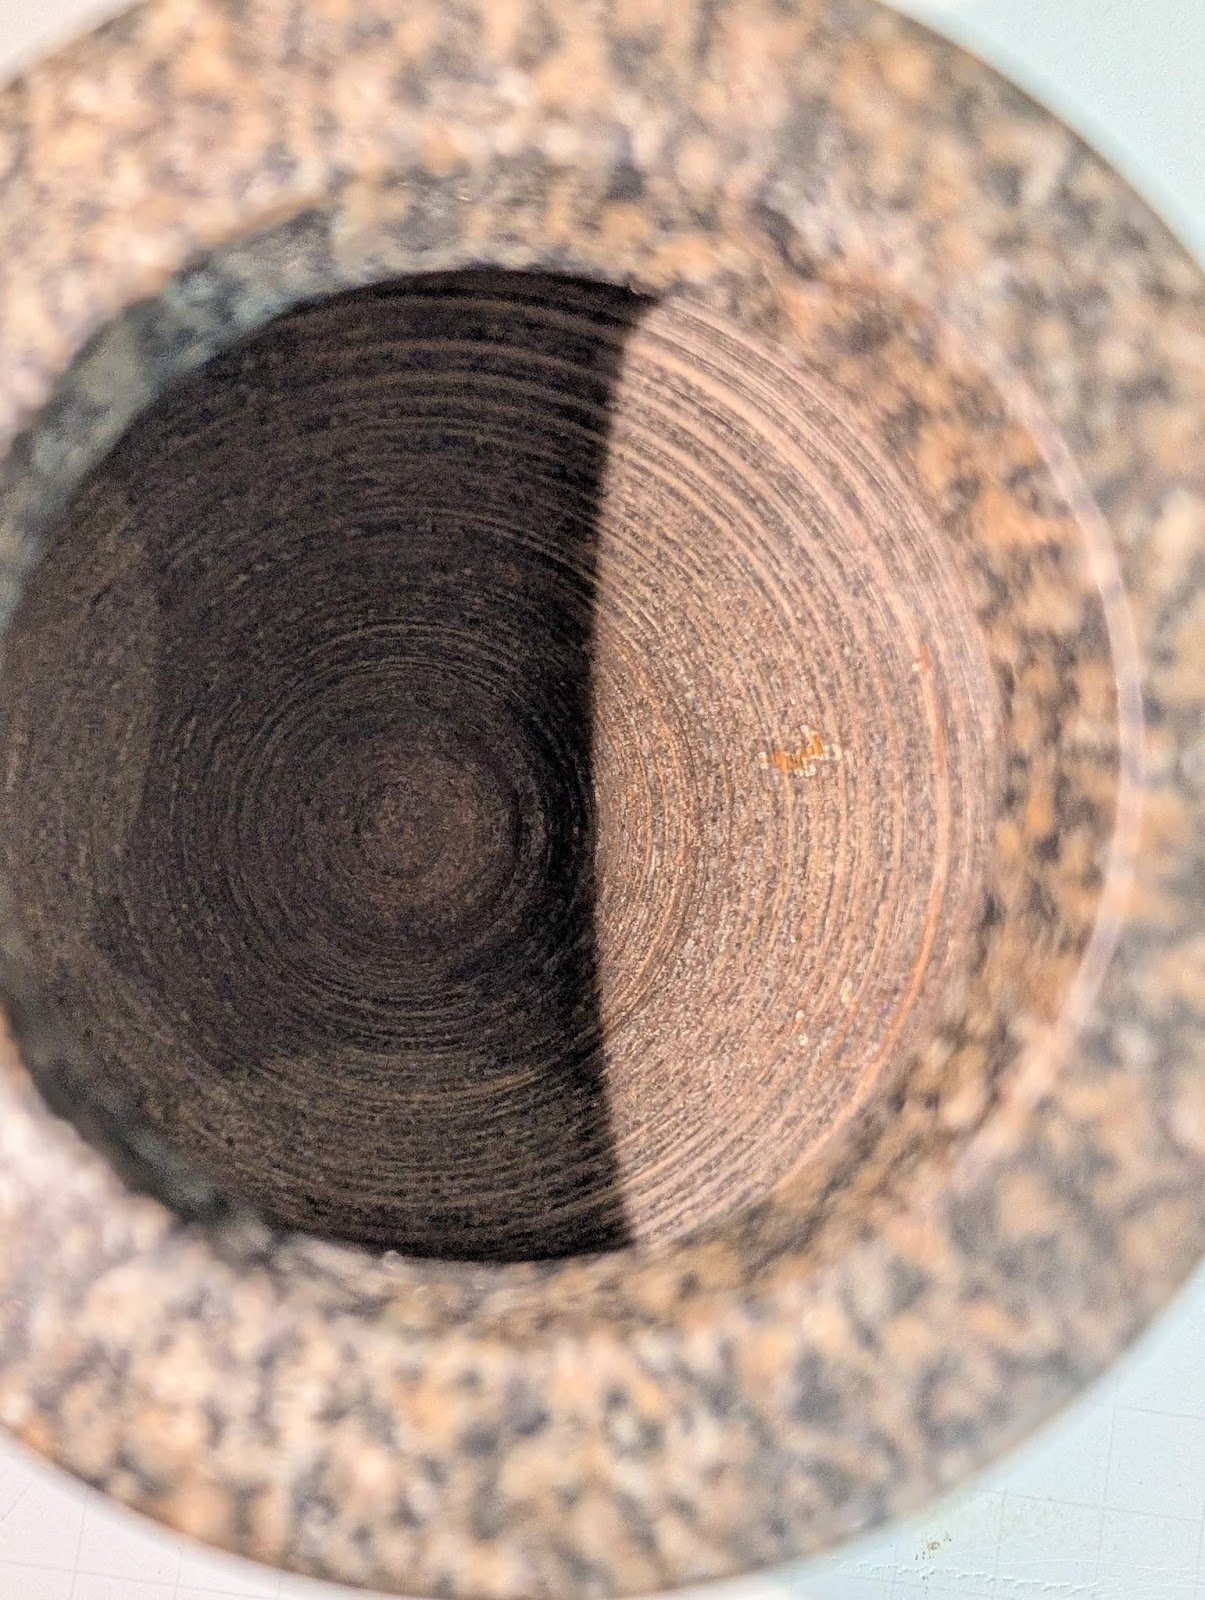
Given these results, I conclude that the ‘PRECISE’ vases in Matt Beall’s collection were machined using advanced tools since the lathe marks are clearly visible on the inner surfaces of the vases where they were not polished away completely – Fig. 20.
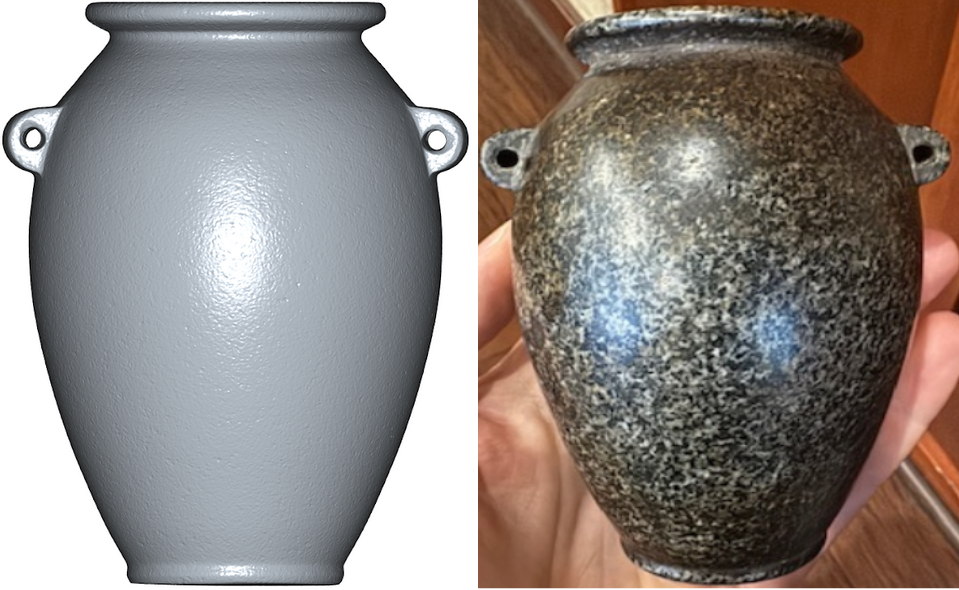
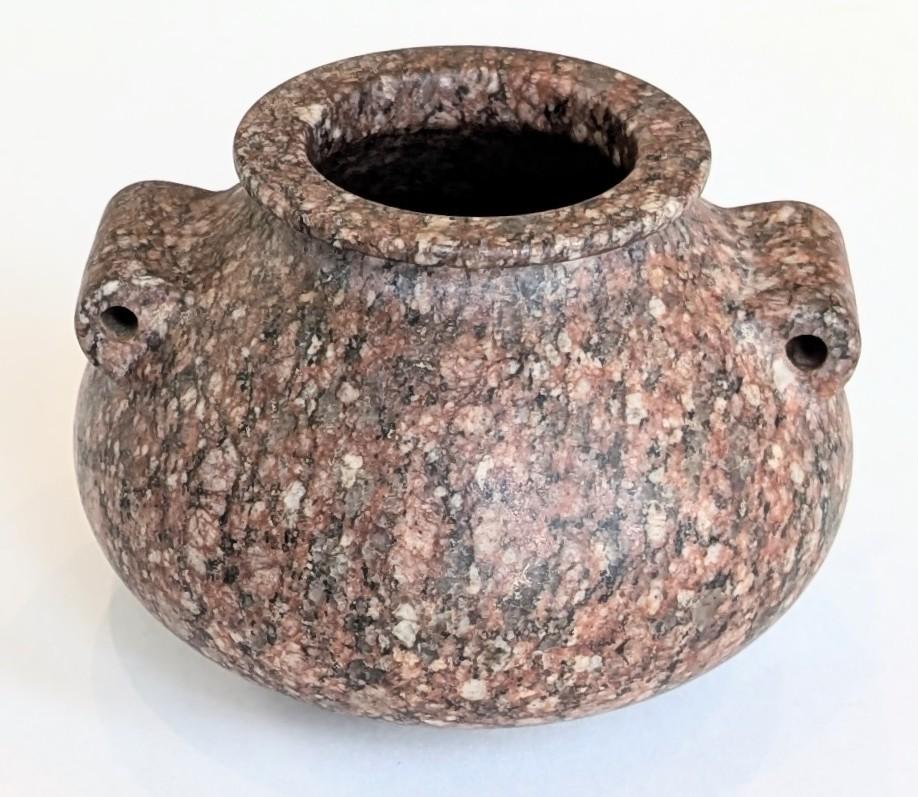
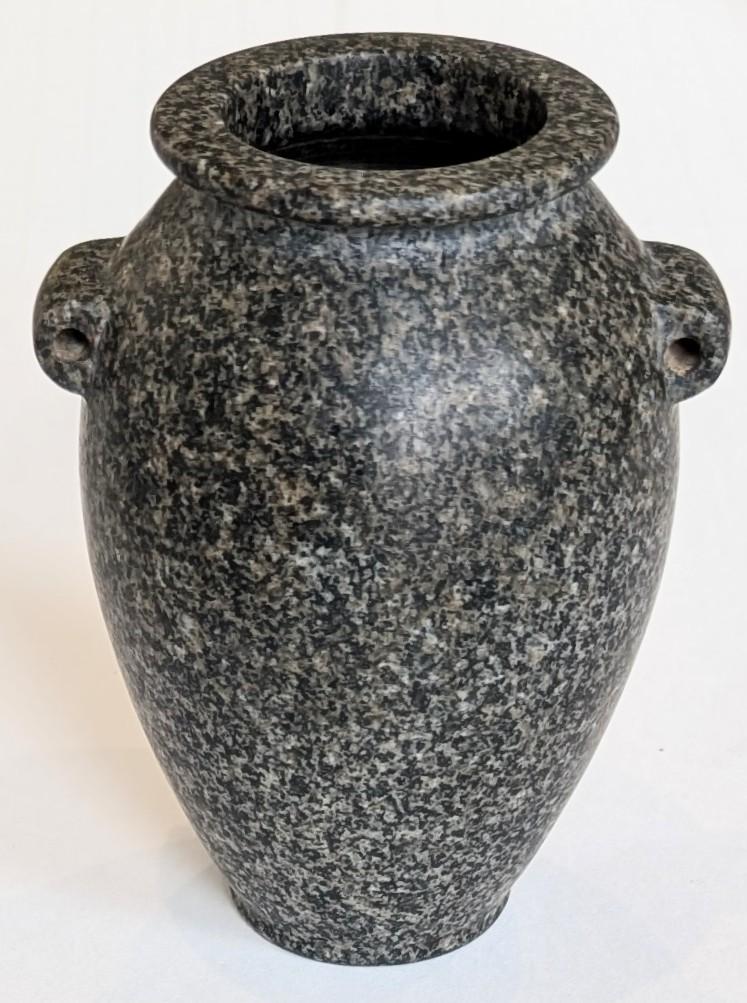
The ‘precise’ vases are strikingly symmetric and beautiful – Fig. 21-22.
The 3D models of CAT scans of the ‘precise’ vases look like CAD models: their symmetry is so perfect that it is difficult to spot any surface profile variability when these models are rotated – Fig. 23-24.

At the same time, the ‘IMPRECISE’ vases appear noticeably imperfect to the naked eye, their lopsidedness made particularly clear by the CAT scan – Fig. 25.

Parabolic Fit
The outer and the inner surfaces of the ‘precise’ vases exhibit excellent fit to a parabola with RMS error on the order of 0.005” – Fig. 26.
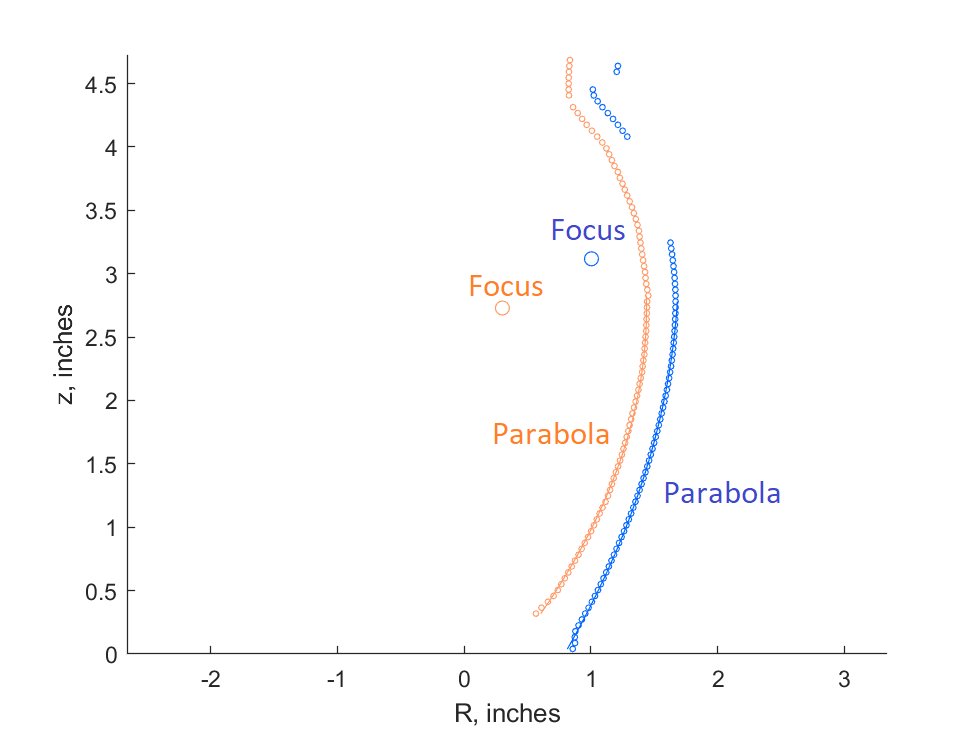
The parabolic fit is evaluated for the slice points beginning from the narrowest slice at the bottom of the vase and ending with the widest slice.
For comparison, parabolic fits of the outer surfaces of the ‘imprecise’ artifacts are on the order of 0.030”.
A Note on the ‘Replica’ Vases
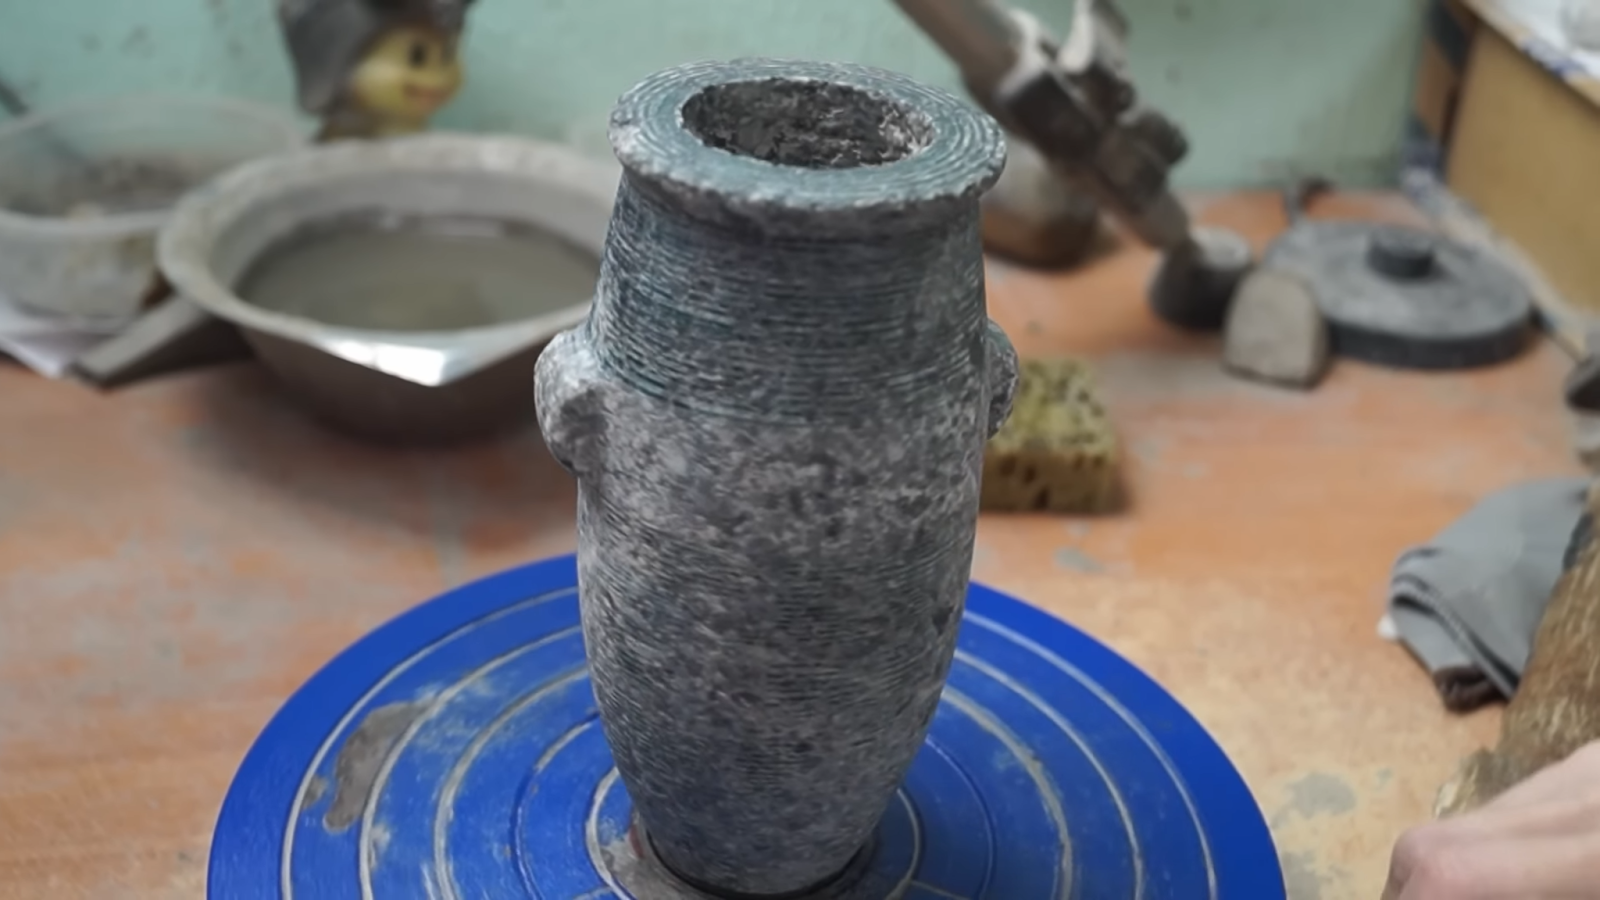
The ‘replica’ vases ‘O1’ and ‘O2’ were made by Olga Vdovina in collaboration with the antropogenez.ru. The objective of the replication effort was to show that it was possible to make stone vases using stone, wood, and copper tools known to ancient Egyptians. The optical scans of the two resulting stone vases are shown in Fig. 27 and 28.
I must point out that Olga Vdovina made the vase ‘O1’ using a plastic rotary table supported by a ball bearing to control the outer surface accuracy through rotation by painting the elevated spots with a sharpie marker – Fig. 29.
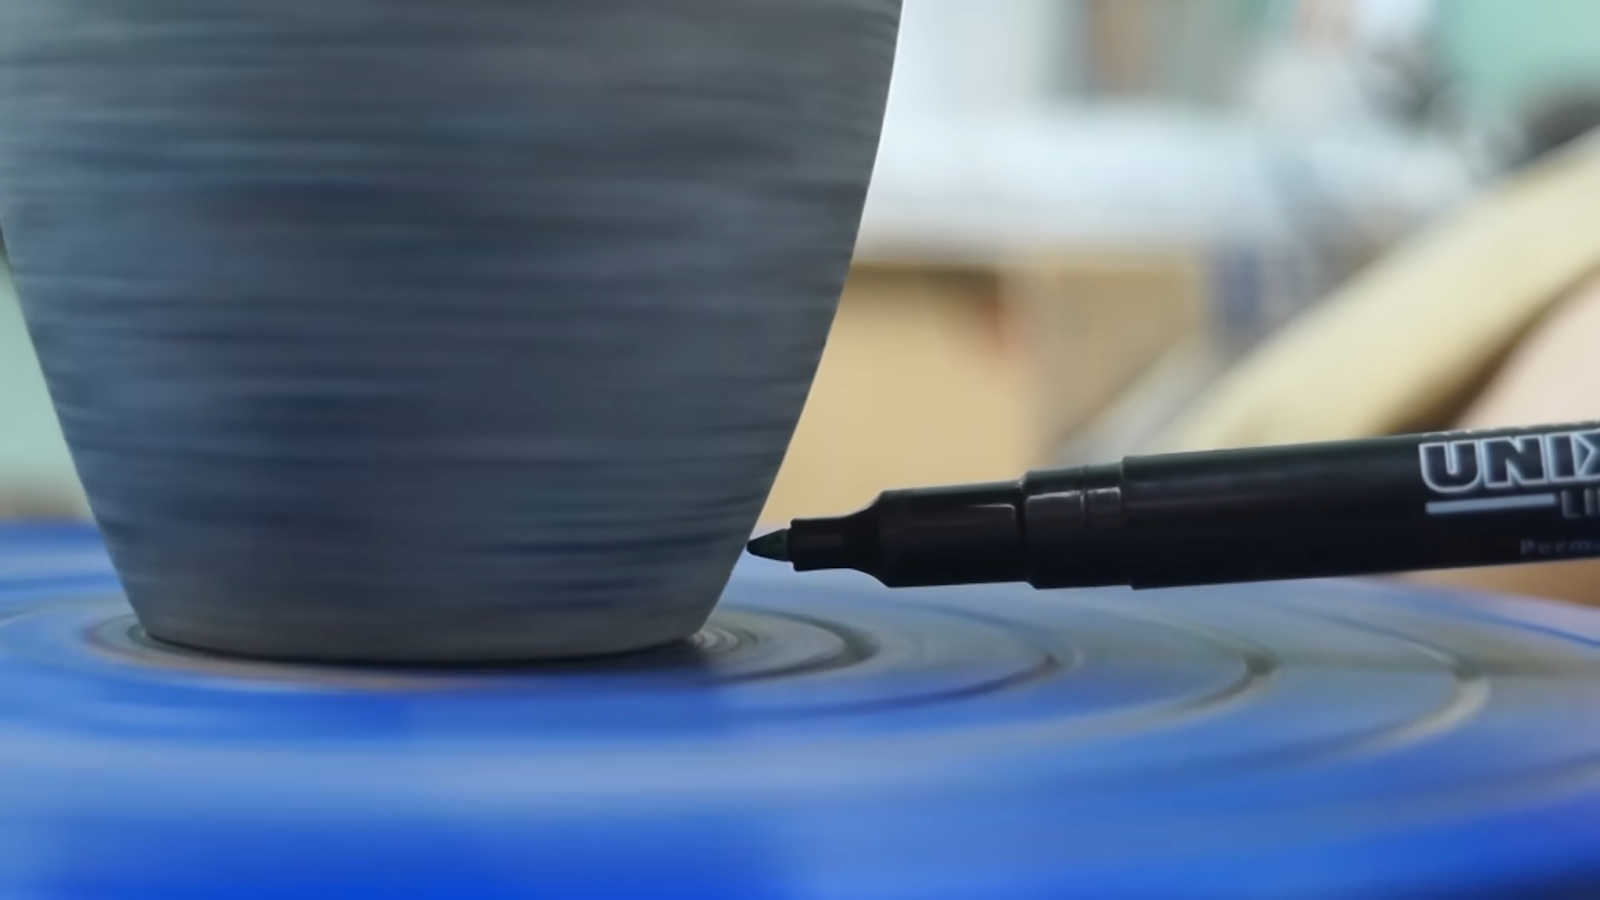
The use of modern technology in making the ‘O1’ vase represented a significant deviation from the initial objective of antropogenez.ru to use only the tools available to the ancient Egyptians. Nevertheless, both vases are classified as ‘IMPRECISE’ according to the proposed quality metric, despite the impressive outer surface circularity of ‘O1’ on only 5 thousandths of an inch. This remarkable circularity was achieved due to the use of the ball-bearing supported rotary table, which is a contemporary piece of technology that was not available to the ancient Egyptians.
Nevertheless, Olga Vdovina’s work proves that one can achieve a remarkable degree of precision when working stone manually. Nevertheless, the quality of the resulting objects is clearly distinguishable from the objects that were machined on a lathe (e.g. ‘M1’, ‘M2’, and ‘M3’).
Next Steps
An effort is underway to study these artifacts using electron microscopy (EDS) and nuclear science, e.g. using high-resolution germanium gamma spectroscopy, x-ray luminescence (XRF), and hopefully neutron activation.
Appendix A: The Sample Provenance
Fig. 30 shows a provenance document for the vase’V18′ from Matt Beall’s collection. This document is representative of other provenance documents accompanying every piece in the collection.

I am not qualified to analyze the provenance documents, but it appears to me that it contains limited information about how and where this object was found beyond listing the name of the previous owner.
