Abstract
Bismuth nitrate solution exposed for 30-60 minutes to a strong electrostatic field (-20 kV potential, ~10 MV/m field strength) exhibits significant alpha, beta and gamma activity. However, the in-depth investigation using the Automated Nuclear Lab system has shown that the observed activity is consistent with the accumulation of positively charged atmospheric radon radioactive decay daughter products in the negatively charged droplet.
Natural Background
Contrary to popular belief, the natural world is full of nuclear activity. Gamma rays, neutrons, alpha and beta particles are constantly emitted by a variety of processes ranging from thunderstorms to cosmic rays. Natural radioactivity of Earth’s crust is a major factor particularly due to release of airborne radon gas, which can accumulate in unexpected places and thus influence and even confuse sensitive nuclear measurements. In this post I show how radon accumulation can affect measurements and what can be done to prevent it.
Setup
Induced decay of bismuth was originally proposed by Baranov and recently discussed by Marakhtanov. In my experiment I generally follow the experimental procedure and setup proposed by Baranov.
Lab grade bismuth nitrate pentahydrate was dissolved in water forming a near-saturated solution, Fig. 1.

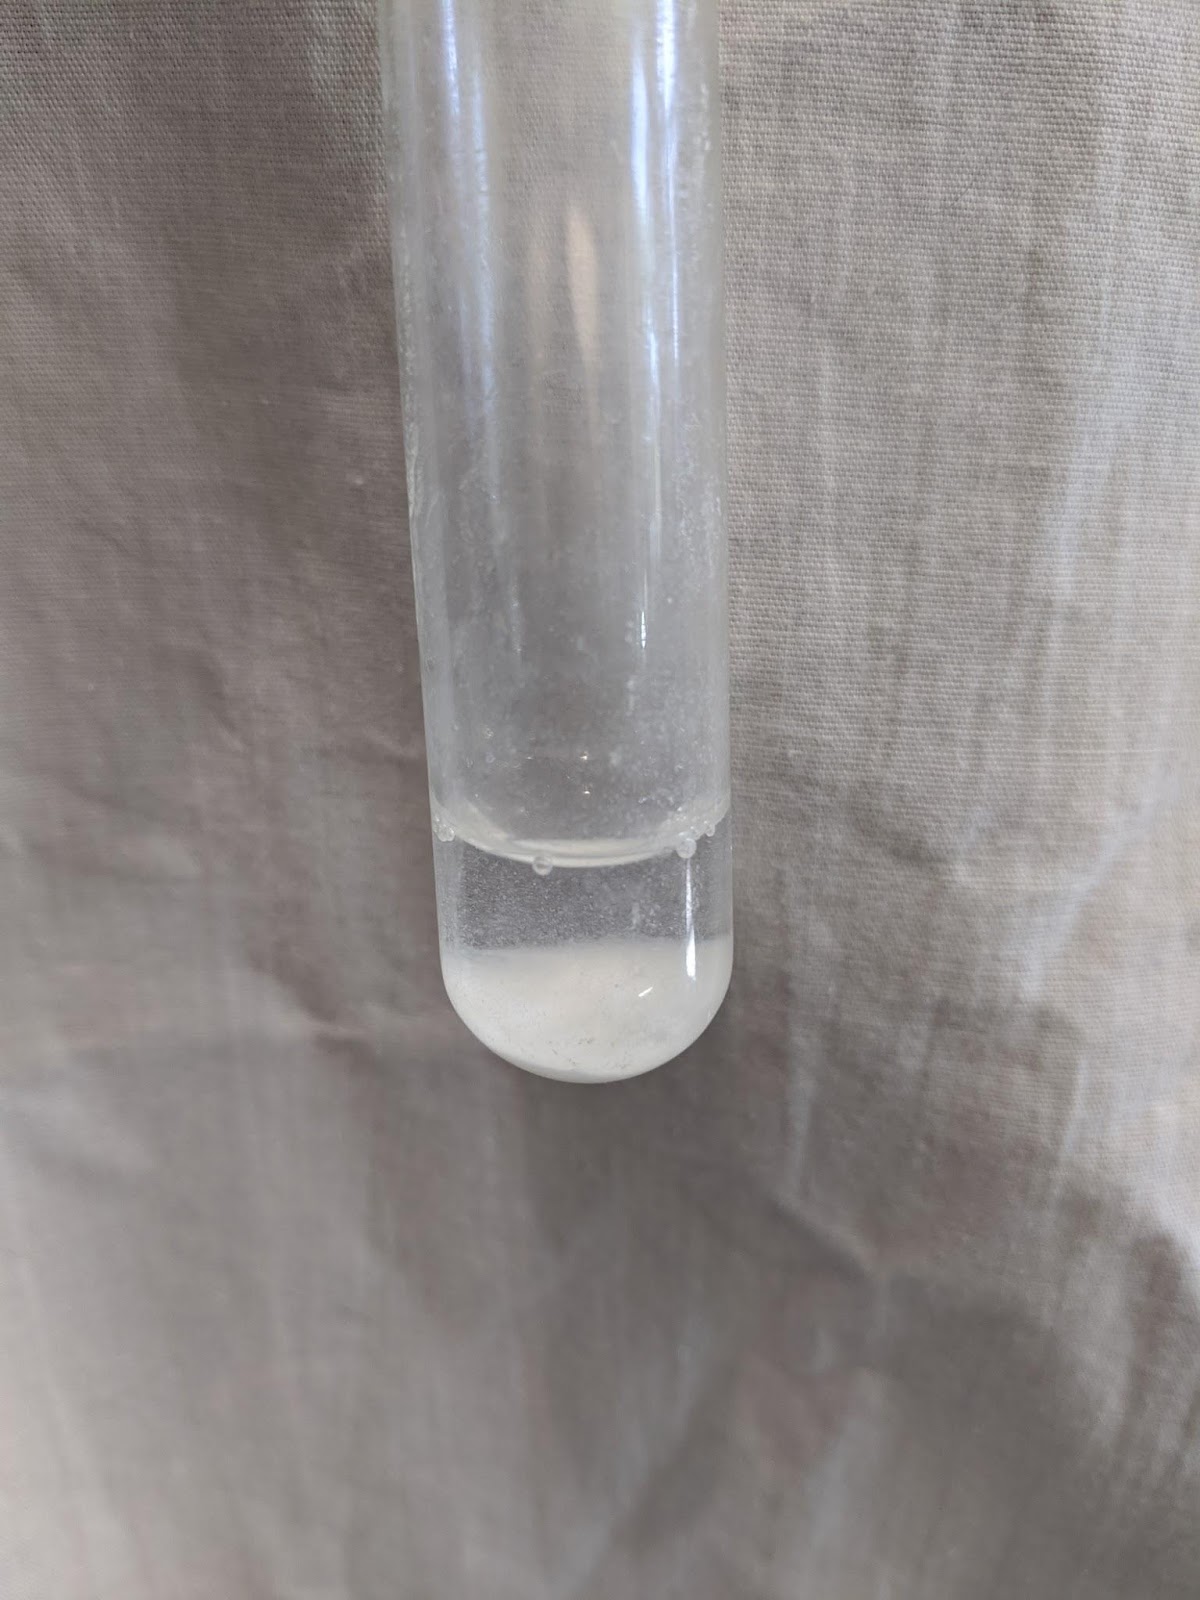
Fig. 1. Bismuth nitrate pentahydrate (left) and it’s water solution (right).
A small amount of this solution was placed onto a 3-mm thick teflon square placed over a grounded aluminum plate. An exposed high-voltage wire was inserted into the droplet. A Spellman SL150 high voltage negative DC power supply – Fig. 2 – was used as a high voltage source.

Fig. 2. Solution droplet with high voltage wire.
The power supply is turned on, exposing the solution to a high voltage potential of -20 kV for 30-60 minutes – Fig. 3.

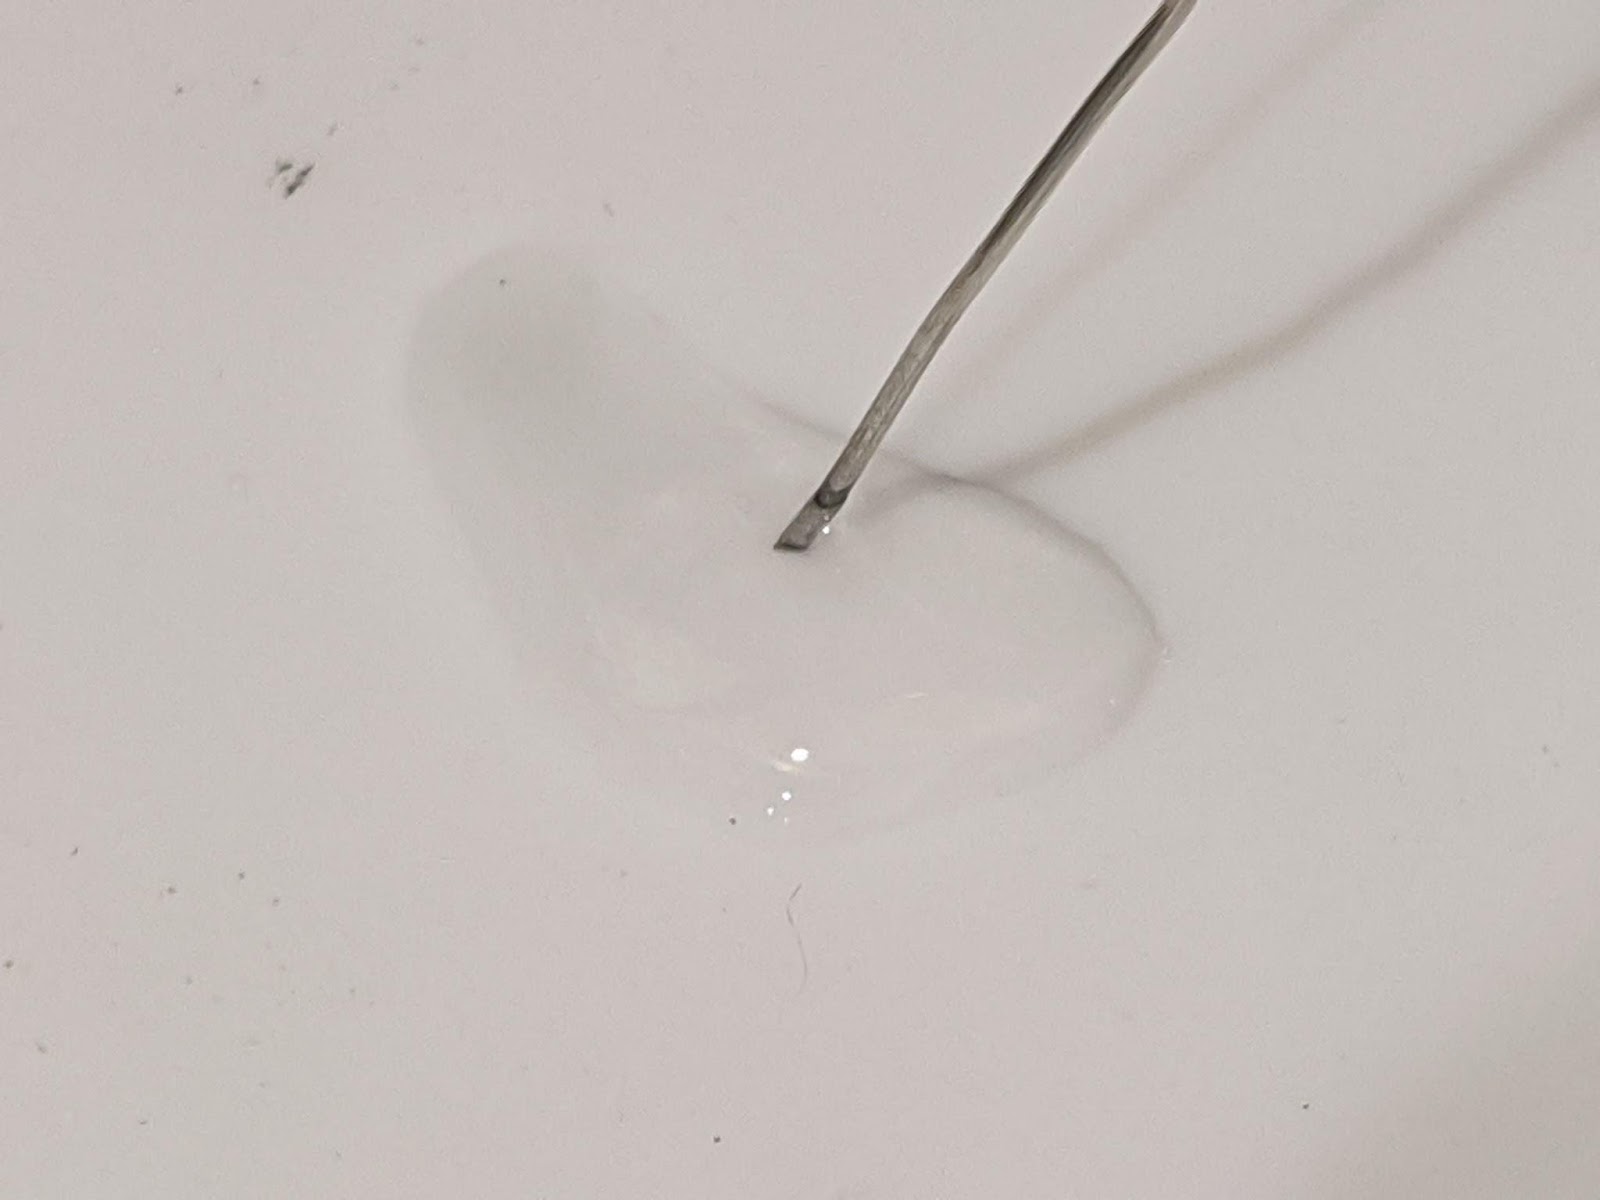
Fig. 3. Spellman high voltage power supply (left), droplet with wire making electric contact (right).
At the start of exposure the droplet might move due to electrostatic repulsion so it may be necessary to ‘catch it’ with the wire and ensure that it stays with the wire and make electrical contact with it (ion wind and electrostatic interaction may move the droplet away from the wire or even split it into several droplets).
During the exposure I hear some hissing as the droplet is close enough to the edge and some ion wind appears to flow from the droplet towards the aluminum underplate (sometimes I can even see the droplet extend in the direction of the edge). Whatever current is flowing it is too low to register on the power supply (this means that the current is < 10 uA). Occasionally I might see a 0.01 mA reading. The voltage stays constant and does not fluctuate.
When I turn off the power supply and remove the wire I either put a small paper towel sheet over the droplet to absorb it or I use a plastic straw to move the droplet around to break it apart and create an assortment of small droplets – Fig. 4. In the interest of time I have not yet developed a drying procedure and therefore was working with the samples absorbed into a paper towel or with small droplets spread around the teflon surface.


Fig. 4 Sample absorbed into a paper towel (left); sample spread around as small droplets over teflon surface (right).
I have conducted the following analytical measurements on the samples:
- Alpha counts using an Eberline AC-3 area detector connected to a Maximus Energy ALPHA-LITE system;
- Beta counts using an NRC MD-45 beta detector connected to a Maximus Energy MCA-PRO 16 system;
- Gamma counts using a Wallac 3” diameter 3” long well-type NaI(Tl) scintillation detector encased by 1” of lead on sides with 1.5” lead bricks on top and bottom, connected to a Maximus Energy MCA-PRO 16 system.
- Gamma counts and spectrum were also captured during the exposure process using the GAMMA-PRO 5” system.
The measurement results are as follows.
Alpha Counts
Alpha particles were detected using an Eberline AC-3 area detector. Counts were logged using a Maximus Energy ALPHA-LITE system – Fig. 5.

Fig. 5. Alpha counting using an Eberline AC-3 area detector connected to a Maximus Energy ALPHA-LITE system.
First I have acquired background counts using Maximus Energy PulseCounter software. I have used counts per minute (CPM) to format the data and acquired multiple background measurements as short as 10 minutes (10 samples) and as long as 10 hours (3600 samples). Typical 60-min background is shown on Fig. 6, mean count rate is 0.32 CPM.

Fig. 6. 60-min alpha background, mean rate 0.32 CPM.
Typical counts from bismuth papers are shown on Fig. 7. Starting counts range from 10 to 60 CPM, which is 100x over the background. Notably, the counts decay with half-life on the order of 50 minutes; Fig. 8 shows an exponential fit to the count rate decay.

Fig. 7. Alpha counts on bismuth paper.

Fig. 8. Exponential fit to the alpha count rate decay; estimated half-life is ~50 min.
Beta Counts
I have recorded beta counts using an NRC MD-45 scintillation beta detector adapted to connect to a Maximus Energy MCA-PRO 16 system – Fig. 9.

Fig. 9. NRC MD-45 scintillation beta detector connected to a Maximus Energy MCA-PRO 16 system.
I have ordered beta calibration sources (such as Sr-90 and Tl-204), but they have not yet arrived. So I have verified the beta detector operation using Cs-137 and Co-60 sources. Then I captured the background for 10 minutes and got a mean count of ~5 CPM – Fig. 10.

Fig. 10. Typical beta background of ~ 5 CPM.
Then I counted a bismuth paper for 10 minutes and got ~9 CPM – Fig. 11. The count rate difference is significant (P = 0.006).
I intend to conduct more beta counts once I am able to boost the beta count rate enough to discern an exponential decay in the count rate. Right now the count rate is too low for a meaningful fit.

Fig. 11. Bismuth paper beta count, mean ~ 9 CPM.
Gamma Counts & Gamma Spectrum
I have recorded gamma counts and gamma spectrum using a Wallac 3” diameter 3” long well-type NaI(Tl) scintillation detector encased by 1” of lead on sides with 1.5” lead bricks on top and bottom, connected to a Maximus Energy MCA-PRO 16 system – Fig. 12.
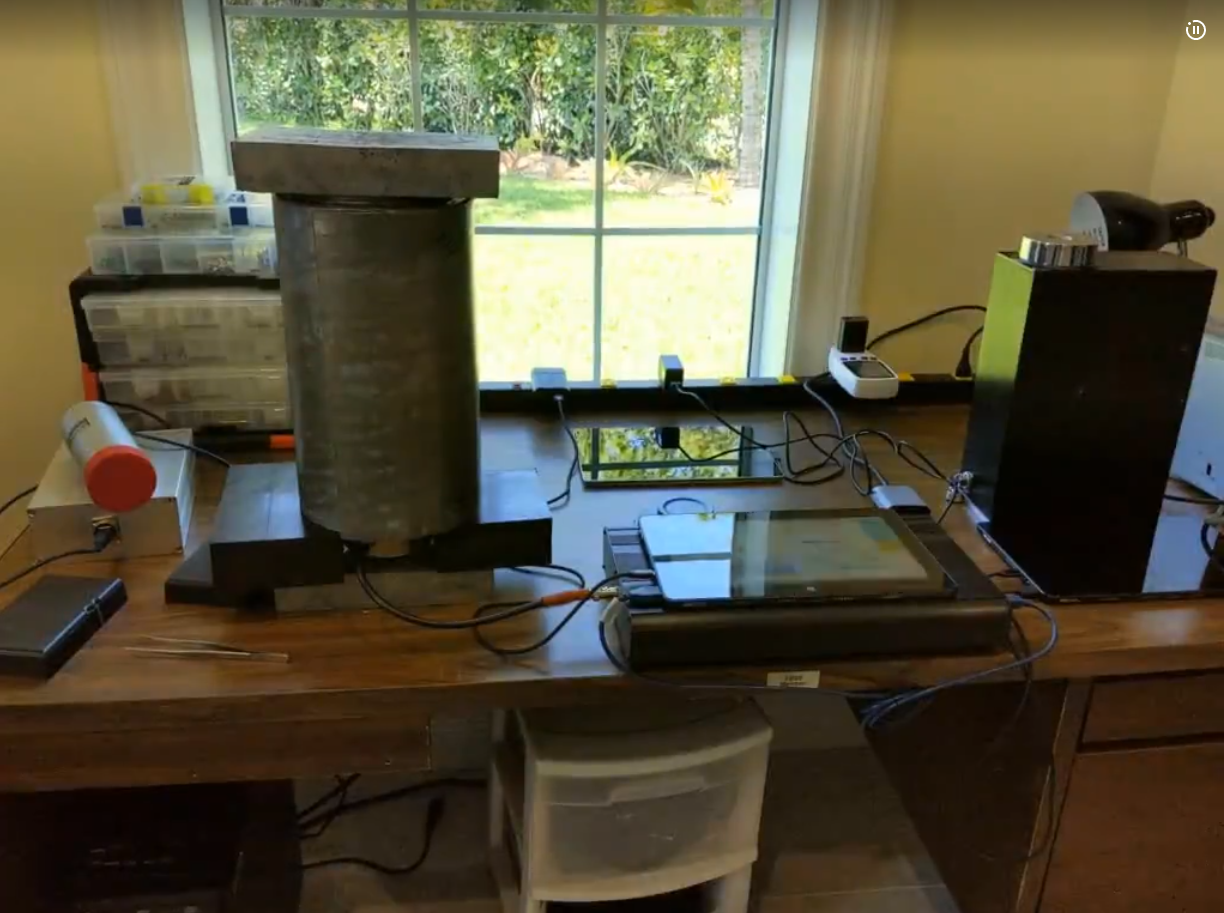
Fig. 12. A Wallac 3” diameter 3” long well-type NaI(Tl) scintillation detector encased by 1” of lead on sides with 1.5” lead bricks on top and bottom, connected to a Maximus Energy MCA-PRO 16 system.
Background counts taken for 3 hours (1,800 CPS samples) and counts from a bismuth paper are shown on Fig. 13. Mean count rate is ~16 CPS for background and ~18 CPS for bismuth paper. Mean counts during the first minutes are much higher and average 24 CPM (50% over background). This result is highly statistically significant (P<0.000). Also, counts exhibit noticeable exponential decay. Differential (bismuth paper minus background) spectrum is shown on Fig. 14.

Fig. 13. Background counts (pink) and spectrum overlaid over experiment data (blue).

Fig. 14. Difference between experiment and background spectrum,4-channel moving average filter applied.
The peak at ~80 keV corresponds to lead x-ray fluorescence and is much more prominent in the experiment spectrum, thus confirming much stronger gamma emission originating from the bismuth paper sample. Additional peaks could be identified as follows:
- 295 keV and 352 keV give a good match for the strongest lines of Pb-214;
- 609 keV, 768 keV and 1,120 keV are consistent with Bi-214.
Other peaks I cannot yet identify. NaI(Tl) detector and the fairly low number of counts do not allow resolving peaks with enough definition to get an accurate measure of emitted gammas (precise energy determination under the low signal conditions calls for a high-resolution HPGe spectrometry). The only conclusion that we can draw with certainty is that there is indeed a gamma emission from the processed sample.
Gamma Activity During the Exposure
I have used a highly-sensitive GAMMA-PRO 5” system deployed at point blank to the charged droplet – Fig. 15- to study the dynamics of gamma counts during the droplet exposure to electric field. Because of the large 5” diameter x 5” long NaI(Tl) scintillator crystal this system generates large quantities (>800 CPS) of background counts. To improve signal to noise ratio I have placed lead bricks (not shown on the photo) around the system and thus reduced the background counts in half. The system was packaged in an aluminum box, which acted as a Faraday cage. This design proved remarkably resilient to EM interference as the system produced no noise in the conditions of high electrostatic activity, poor grounding and occasional arc breakdowns.

Fig. 15. GAMMA-PRO 5” system counting gammas next to the charged droplet.
I did observe the increase in gamma activity, which coincided with the charging of the droplet (Fig. 16, blue). The activity subsequently decayed and returned to the pre-experimental baseline in about 2 hours after the high voltage was turned off (Fig. 16, pink).

Fig. 16. Evolution of gamma counts during the droplet charging (blue) and after the power was turned off (pink): one can clearly see an up- and down-trends respectively.
Control Experiment
Upon examination of the results Dudley Emer suggested exposing a pure water droplet to the same experimental protocol to rule contamination of the charged droplet with the decay products of atmospheric radon. These positively charged ions will be attracted to the negatively charged droplet and thus effectively concentrate in it during the droplet’s exposure to high negative potential. The radon decay products will exhibit alpha activity with halflife of about 50 minutes and will produce gamma spectrum showing 214Pb peaks. Both are consistent with our observation, so atmospheric radon is definitely a concern.
So, I took a tap water droplet and charged it for 1 hour. Then I absorbed the droplet into a piece of a paper towel for alpha counting. The results looked remarkably similar to the results obtained with bismuth salts and showed characteristic ~50 min half life, Fig. 17.

Fig. 17. Alpha counts originating from a pure water droplet exposed to nigh negative potential of -20 kV for 1 hour. Significant alpha activity with half-life of about 50 minutes is clearly visible.
Thus, our observed activity on bismuth paper is indistinguishable from that observed with pure water and therefore is most likely caused by atmospheric radon decay product accumulation in the charged droplet.
Sealed Experiment
To rule out the atmospheric radon contamination with certainty I have ran two additional experiments: one by charging the droplet in a sealed environment (i.e. I have placed a plastic cup around the droplet to prevent radioactive ion transfer by airflow), and the other using a positively charged potential. The resulting alpha counts are consistent with background, Fig. 18.

Fig. 18. Alpha counts from bismuth exposed to -20 keV electric potential in a sealed vial (blue) and background (pink).
Conclusions
Natural radioactivity can easily influence results of sensitive measurements. Radioactive ions (like those originating from radon decay) are positively charged and therefore are attracted to and accumulate in areas of high negative potential. Therefore it is advisable to conduct sensitive experiments in a hermetically sealed environment and allow for 8-24 hours for the natural background in any captured gas to diminish prior to starting measurements.
Acknowledgements
I thank Ross Koningstein, Dud Femer and Sky Jelsma for helpful suggestions and help editing this post.